
Las Vegas Industrial Market Report
Third Quarter 2018
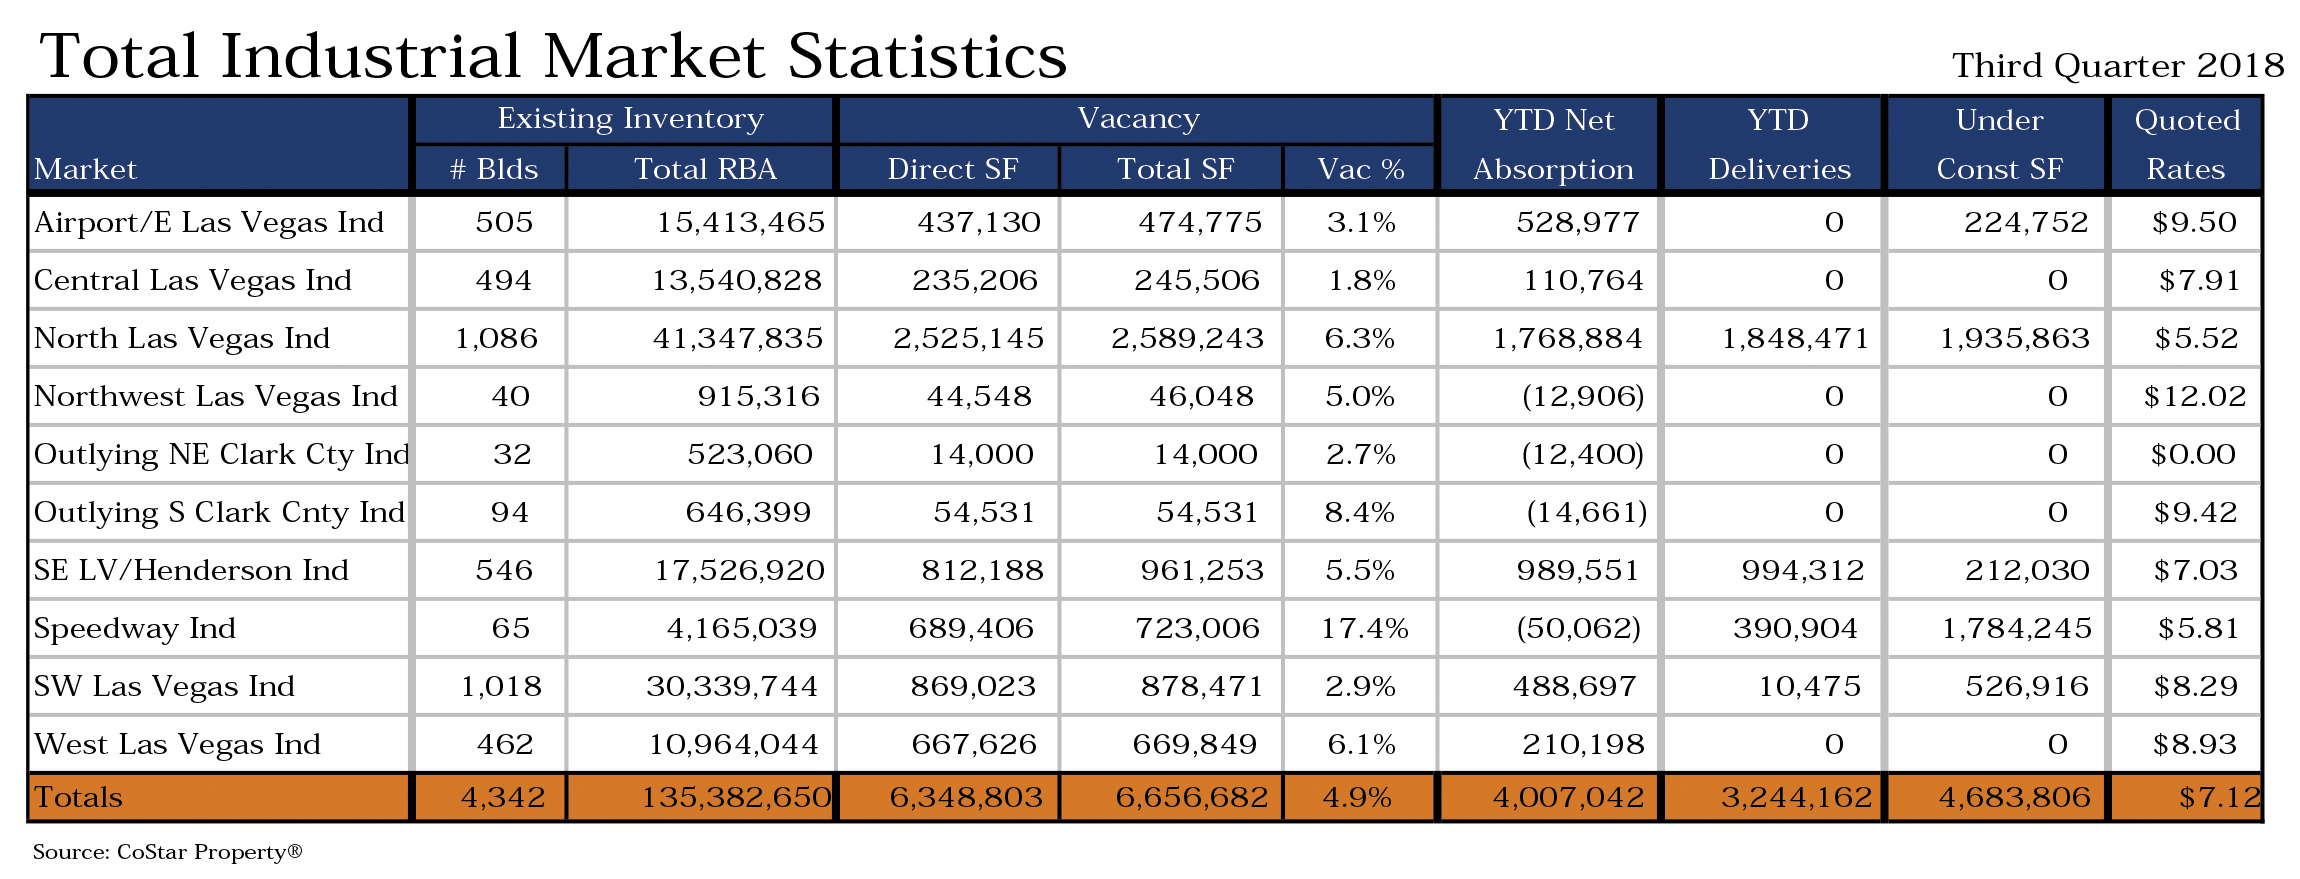
Inventory
Total Industrial inventory in the Las Vegas market area amounted to 135,382,650 square feet in 4,342 buildings as of the end of the third quarter 2018. The Flex sector consisted of 22,263,773 square feet in 976 projects. The Warehouse sector consisted of 113,118,877 square feet in 3,366 buildings. Within the Industrial market there were 320 owner-occupied buildings accounting for 15,392,962 square feet of Industrial space.
Sales Activity
In the second quarter, 23 industrial transactions closed with a total volume of $286,745,739. The 23 buildings totaled 3,468,448 square feet and the average price per square foot equated to $82.67 per square foot. That compares to 14 trans-actions totaling $56,124,000 in the first quarter. The total square footage was 526,078 for an average price per square foot of $106.68.
Cap rates have been lower in 2018, averaging 5.94%, compared to the first six months of last year when they aver-aged 6.61%.
Tallying industrial building sales of 15,000 square feet or larger.
Mark of a Market.
One of the largest transactions that has occurred within the last four quarters in the Las Vegas market is the sale of Prologis Park in North Las Vegas. This 833,787-square-foot industrial building sold for $67,585,000, or $81.06 per square foot. The property sold on 8/1/2017.
The information in this post has been sourced by and is credited to ©2018 CoStar Group, Inc.


